Cutting Edge Property Maintenance, Inc. Acquired by BrightView

BrightView Acquires Commercial Landscape Firm Cutting Edge Property Maintenance, Inc.

BrightView Holdings, Inc. (NYSE: BV) (“BrightView”), the leading commercial landscaping services company in the United States, today announced the acquisition of Cutting Edge Property Maintenance, Inc. based in Plymouth, Minn. Terms of the transaction were not disclosed.

“Cutting Edge has earned a reputation for providing superior service, which creates lasting client satisfaction,” said BrightView President and CEO Andrew Masterman. “They have the expertise and capabilities to provide a full suite of winter services, landscape maintenance and enhancements, tree care, and irrigation services. This deal brings a service leader in a desirable Upper Midwest market into the BrightView family along with more than 110 skilled team members.”

Founded in 2005 Cutting Edge Property Maintenance is one of the Twin Cities’ leading commercial outdoor maintenance services providers with a reputation for attention to detail, client service, employee safety and superior workmanship.

“We could genuinely tell BrightView’s executive team cares about their people, which was an important factor in our decision-making process,” said Ryan Comer, Cutting Edge Founder and CEO. “We are confident that joining BrightView will provide opportunities for both our employees and our customers. BrightView is a first-class organization that the Minneapolis market is fortunate to have.”

Blue Bell - Corporate

NBRI Recognizes BVLS and BVLD for Their Commitment to Customer Engagement

NBRI Recognizes BVLS and BVLD for Their Commitment to Customer Engagement High levels of Customer Engagement earn BrightView a place in National Business Research Institute's Circle of Excellence

The National Business Research Institute (NBRI) is pleased to welcome BrightView Landscapes Services (BVLS) and BrightView Landscape Design (BVLD) to the NBRI Circle of Excellence. The NBRI Circle of Excellence Award recognizes organizations that place a high value on Employee and Customer engagement. These organizations demonstrate their dedication by conducting best in class survey research with NBRI and taking action based upon the results. NBRI commends the leadership of these organizations for their commitment to the Continuous Improvement Process and recognizes their achievements with the Circle of Excellence Award.

To qualify for this honor, the organization must score at or above Stretch Performance at the 75th benchmarking percentile when measured against their industry, or the organization must improve 5 or more benchmarking percentiles in total company score over the previous research study, a statistically significant amount. It is no small feat to move an entire company’s score of customer loyalty or employee engagement 5 or more percentiles, or to reach Stretch or Best in Class Performance levels.

“Customer Engagement drives Financial Performance,” said Dr. Jan G. West, Ph.D., CEO & Organizational Psychologist at NBRI. “This award is a result of BrightView’s dedication to measuring and improving their Customer Engagement.”

About NBRI:
NBRI conducts Employee, Customer, and Market Research for businesses, and uses this data to help organizations leverage these human factors to make improvements to operations and strategy. With its extensive experience across all industries, NBRI’s research teams bring their clients a combination of deep industry knowledge and expert advice. NBRI’s mission is to help their Clients set new standards of excellence in their industries. NBRI product offerings, such as the Root Cause Analysis, ensures their clients will focus on the most impactful issues.

Blue Bell - Corporate

Sustainability Maintenance of Superior Contracted to BrightView

Sustainability Maintenance of Superior’s Parks & Recreation Areas Contracted to BrightView Services to the Colorado town include all public areas and snow removal

BrightView Maintenance has been selected by Colorado’s Town of Superior to maintain its park and recreation landscapes starting Jan. 1, 2020. The contract covers more than 630 acres of parks, green space, and open space, the Town of Superior, and its 35 miles of public trails.

The agreement includes sustainable landscaping maintenance and snow removal for the public grounds, parks, and walkways throughout the town.

BrightView is one of the nation’s largest users of zero-emission commercial landscaping equipment and also a leader in the use of state-of-the-art water conservation technology and innovative landscaping practices, such as green roof installations, LEED-certified landscape consulting, waste reduction programs, and xeriscaping.

“Being able to partner with the Town of Superior and provide sustainable landscaping is a point of pride for Brightview,” said Bradley Hill, BrightView Senior Branch Manager. “Our team is thrilled to not only provide green landscaping to some of the most stunning trails in Colorado, but to also make a lasting connection with this close-knit community.”

The Town of Superior was founded in 1896 and is believed named after the "superior" quality of coal found in the area. The stunning mountain-filled backdrop is enhanced by the vast public spaces and parks throughout the town.

“The Town of Superior is looking forward to working together with BrightView to serve all who live, work, and play in our community,” said Leslie Clark, Parks, Recreation and Open Space Director, Town of Superior.“ We believe BrightView and their people will provide us with the excellence we have become accustomed to, as well as propel us into the future of renewable energy and sustainability.”

Learn more about the parks, trails, open space, and recreation within the Town of Superior here.

About The Town of Superior:
The Town of Superior is a municipality of approximately 15,000 people located 22 miles northwest of Denver and 8 miles southwest of Boulder, Colorado. Incorporated in 1904 and named for the “superior” quality of the coal it produced in the local mine, the Town boasts a rich history. The Town now consists of four-square miles that include hundreds of acres of quality parks, open space and trails produced and maintained for the enjoyment of residents and visitors.

Environmental Sustainability
Parks & Recreation Areas in Superior
Blue Bell - Corporate

Award-Winning Work at UC Merced Campus Recognized

BrightView’s Award-Winning Work at UC Merced Campus Recognized
BrightView was honored to have been selected as one of several design build trade partners exclusively chosen for the UC Merced 2020 Project.

The University of California Merced campus, one of the nation’s leading public colleges, recently completed a four-year construction expansion. BrightView proudly provided landscape and site hardscape to this massive project, featured in the December issue of CalContractors Magazine.

The three-phase campus extension, which took place from October 2016 to June 2020, nearly doubled the size of UC Merced’s campus.

Lead by a P3 development team, Webcor Builders selected BrightView for the 1.2 million -square-foot campus. Webcor Builders is a premier commercial construction service provider known for its innovative and efficient approach, a wide range of experience, and cost-effective design-build methodology.

“BrightView assembled a great team for the UC Merced 2020 Project,” said Jacob Gliddon, Webcor Builders Site Project. “They exceeded all expectations and I look forward to working with them again in the future.”

UC Merced is a widely recognized campus for its commitment to environmental sustainability, an important priority during the campus expansion. BrightView provided more than 61 miles of drip irrigation instillation for a campus-wide water conservation effort. The work provided throughout the campus also included 805 trees, 41,000 shrubs, wetland and grassland hydroseeding, landscape drainage, and various campus-wide accommodations. BrightView also placed more than 500 cubic yards of soil each day.

While landscape development operations continued, campus life went on. To ensure the safety of all students and staff during the construction, BrightView provided safe pedestrian access during the various development phases.

“Safety was our number one concern as we concentrated on getting students and faculty to their newly built classrooms, dorms, cafeterias, and other facilities,” said Dustin Harter, BrightView Project Superintendent.

The work provided by BrightView Landscape Development on UC Merced also lead the team to win the 2018 United Contractors R.E.A.L. Safety Award for their three-year safety record without a loss day.

“I am extremely proud of BrightView’s design-build team members whom collaboratively partnered with Webcor Builders and the trade partner teams on this design-build to provide UC Merced with an incredible finished product,” said Skip Stevens, BrightView Landscape Development Vice President and General Manager.

CalContractor Magazine is a monthly magazine that is widely distributed to California contractors and features industry news. Read the full article on this award-winning work here.

Development
Content Hero Image
BrightView’s Award-Winning Work at UC Merced Campus Recognized

BrightView Reports Fourth Quarter and Full Year Fiscal 2020 Results

BrightView Reports Fourth Quarter and Full Year Fiscal 2020 Results

BrightView Holdings, Inc. (NYSE: BV) (the “Company” or “BrightView”), the leading commercial landscaping services company in the United States, today reported unaudited results for the fourth quarter and audited results for the full fiscal year ended September 30, 2020.

This press release features multimedia. View the full release here: https://www.businesswire.com/news/home/20201118005277/en/ 

(Graphic: Business Wire)

(Graphic: Business Wire)

“Our fourth quarter and full year results highlight the continued resiliency of our contract-based business, reflect the positive underlying trends of our strong-on-strong acquisition strategy, and the benefits of the investments we are making in being a best-in-class maintenance services company. This quarter we delivered strong cash generation and liquidity, underpinned by our on-going focus on working capital and reducing capital expenditures,” said Andrew Masterman, BrightView President and Chief Executive Officer. “Our services and results of operations continue to benefit from a designation as an essential service. And our team continues to do an incredible job responding to the COVID-19 crisis by prioritizing health and safety, focusing on our client relationships, and by delivering solid results in a challenging operating environment.”

“Despite ancillary softness and project delays, COVID-19 impacts to date have been modest due to our resilient contract revenue base, and our earnings have benefitted from cost management actions. Cash generation remains healthy, margins strong, our capex requirements remain modest, and we expect our M&A pipeline to continue to be a reliable and sustainable source of revenue growth,” Masterman said. “We expect COVID-19 impacts will continue to be felt over the next few quarters as conditions remain fluid. That said, we believe we are in a strong position to return to positive growth in fiscal 2021, with continued strong cash generation and solid Adjusted EBITDA results. And, we believe the digital, sales, training and other investments we are making in strengthening our business will drive long-term best-in-class performance.”

1 Adjusted EBITDA is a non-GAAP measure. Refer to the “Non-GAAP Financial Measures” section for more information. The Company is not providing a quantitative reconciliation of its financial outlook for Adjusted EBITDA to net income (loss), its corresponding GAAP measure, because the GAAP measure that is excluded from its non-GAAP financial outlook is difficult to reliably predict or estimate without unreasonable effort due to its dependence on future uncertainties, such as items discussed above. Additionally, information that is currently not available to the Company could have a potentially unpredictable and potentially significant impact on its future GAAP financial results.

Adjusted EBITDA, Adjusted EBITDA Margin, Adjusted Net Income, Free Cash Flow and Adjusted Earnings per Share are non-GAAP measures. Refer to the “Non-GAAP Financial Measures” and “Reconciliation of GAAP to Non-GAAP Financial Measures” sections for more information.

Fourth Quarter Fiscal 2020 Highlights

  • Net cash provided by operating activities of $83.2 million, an increase of 37.5% compared to $60.5 million in the prior year period.
  • Free Cash Flow of $77.4 million, an increase of 61.9% compared to the prior year period of $47.8 million.
  • Total revenue of $608.1 million; a 2.7% decrease compared to the prior year period of $624.8 million.
  • Maintenance land revenue of $444.0 million; a 2.6% decrease compared to the prior year period of $455.7 million;
  • Development revenue of $165.1 million, a 3.3% decrease compared to the prior year period of $170.7 million.
  • Net Loss of $6.1 million, or $(0.06) per share, and a net loss margin of 1.0%, compared to Net Income of $25.1 million, or $0.24 per share, and a net income margin of 4.0%, in the prior year period.
  • Adjusted EBITDA of $90.0 million and Adjusted EBITDA margin of 14.8%, compared to Adjusted EBITDA of $91.9 million and Adjusted EBITDA margin of 14.7% in the prior year period.

Full Year Fiscal 2020 Highlights

  • Net cash provided by operating activities of $245.1 million, an increase of 44.4% compared to $169.7 million in the prior year.
  • Free Cash Flow of $197.2 million, an increase of 127.7% compared to the prior year of $86.6 million.
  • Total revenue of $2,346.0 million, a 2.4% decrease compared to $2,404.6 million in the prior year.
  • Maintenance revenue of $1,739.1 million, a 4.1% decrease compared to the prior year of $1,813.4 million;
    • Land revenue of $1,576.0 million, 0.5% growth compared to the prior year of $1,568.3 million;
    • Snow revenue of $163.1 million, a 33.5% decrease compared to the prior year of $245.1 million.
  • Development revenue of $610.6 million, a 2.6% increase compared to the prior year of $595.4 million.
  • Net Loss of $41.6 million, or $(0.40) per share, and a net loss margin of 1.8%, compared to Net Income of $44.4 million, or $0.43 per share, and a net income margin of 1.8%, in the prior year.
  • Adjusted EBITDA of $271.6 million and Adjusted EBITDA margin of 11.6%, compared to Adjusted EBITDA of $305.1 million and Adjusted EBITDA margin of 12.7% in the prior year.

“During the quarter we generated a record $77.4 million in Free Cash Flow, totaling $197.2 million for the full fiscal year, also a record for the Company,” said John Feenan, BrightView Executive Vice President and Chief Financial Officer. “We continue to maintain a disciplined financial policy while remaining intensely focused on accretive transactions and paying down debt. The fundamentals of our business and our industry remain strong and our cash generation, combined with continued modest capital needs, will continue to drive stockholder value.”

Fiscal 2020 Results – Total BrightView

Total BrightView - Operating Highlights


Three Months Ended
September 30,


Fiscal Year Ended
September 30,

($ in millions, except per share figures)


2020


2019


Change


2020


2019


Change

Revenue


$

608.1


$

624.8


(2.7%)


$

2,346.0


$

2,404.6


(2.4%)

Net (Loss) Income


$

(6.1

)


$

25.1


(124.3%)


$

(41.6

)


$

44.4


(193.7%)

Net (Loss) Income Margin


(1.0

%)


4.0

%


(500) bps


(1.8

%)


1.8

%


(360) bps

Adjusted EBITDA


$

90.0


$

91.9


(2.1%)


$

271.6


$

305.1


(11.0%)

Adjusted EBITDA Margin


14.8

%


14.7

%


10 bps


11.6

%


12.7

%


(110) bps

Adjusted Net Income


$

38.3


$

45.0


(14.9%)


$

94.7


$

118.0


(19.7%)

(Loss) Earnings per Share, GAAP


$

(0.06

)


$

0.24


125.0%


$

(0.40

)


$

0.43


193.0%

Earnings per Share, Adjusted


$

0.37


$

0.44


(15.9%)


$

0.91


$

1.15


(20.9%)

Weighted average number of common shares outstanding


103.9


102.8


1.1%


103.7


102.7


1.0%

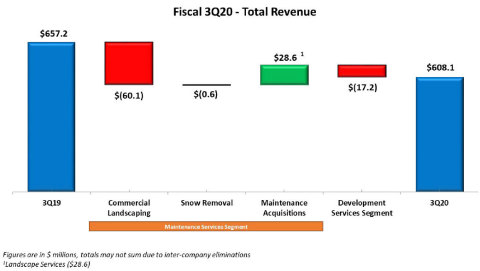
For the fourth quarter of fiscal 2020, total revenue decreased 2.7% to $608.1 million due to decreases in both the Maintenance Services Segment and Development Services Segment revenues. Net Loss was $6.1 million compared to Net Income of $25.1 million in the 2019 period, attributable to an increase in non-recurring expenses and a decline in gross profit and gross profit margin principally due to lower ancillary revenue, partially offset by decreases in Interest expense and Income tax expense. Total Adjusted EBITDA decreased 2.1% to $90.0 million from $91.9 million in the 2019 period. Maintenance Services Segment Adjusted EBITDA of $77.2 million remained flat compared to the 2019 period. Development Services Segment Adjusted EBITDA decreased slightly to $26.3 million from $26.7 million in the 2019 period. The Segment Adjusted EBITDA results are discussed further below.

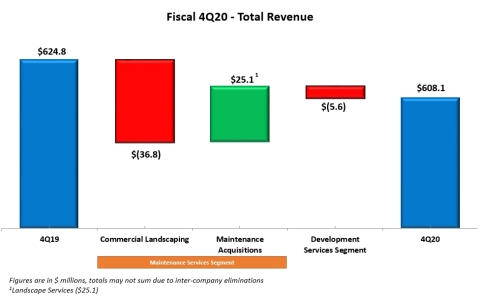
For the fiscal year ended September 30, 2020, total revenue decreased 2.4% to $2,346.0 million due to a decrease in Maintenance Services Segment revenues driven by meaningfully lower snowfall as compared to historical averages as well as a reduction in demand for ancillary services as a result of the COVID-19 pandemic, partially offset by an increase in Development Services Segment revenues. Total Adjusted EBITDA was $271.6 million, down 11.0% versus the prior year, principally due to a decrease in Maintenance Services Segment Adjusted EBITDA driven by the decremental margins as a result of the lower snow revenue as well as a reduction in demand for ancillary services as a result of the COVID-19 pandemic. Development Services Segment Adjusted EBITDA decreased slightly to $80.2 million from $81.7 million in the 2019 period. Corporate expenses remained flat when compared to the prior year. The Segment Adjusted EBITDA results are discussed further below.

Fiscal 2020 Results – Segments

Maintenance Services - Operating Highlights


Three Months Ended
September 30,


Fiscal Year Ended
September 30,

($ in millions)


2020


2019


Change


2020


2019


Change

Landscape Maintenance


$

444.0


$

455.7


(2.6%)


$

1,576.0


$

1,568.3


0.5%

Snow Removal


$

(0.1

)


$

(0.3

)


66.7%


$

163.1


$

245.1


(33.5%)

Total Revenue


$

443.9


$

455.4


(2.5%)


$

1,739.1


$

1,813.4


(4.1%)

Adjusted EBITDA


$

77.2


$

77.2


0.0%


$

250.1


$

282.0


(11.3%)

Adjusted EBITDA Margin


17.4

%


17.0

%


40 bps


14.4

%


15.6

%


(120) bps

Capital Expenditures


$

6.6


$

10.9


(39.4%)


$

40.6


$

65.4


(37.9%)

For the fourth quarter of fiscal 2020, revenue in the Maintenance Services Segment decreased 2.5% to $443.9 million. Revenues from landscape maintenance services were $444.0 million, a decrease of $11.7 million over the 2019 period, driven by a $36.8 million decrease principally due to a reduction in demand for ancillary services as a result of the COVID-19 pandemic, partially offset by a $25.1 million revenue contribution from acquired businesses.

Adjusted EBITDA for the Maintenance Services Segment in the quarter remained flat at $77.2 million. Overhead cost reductions in the quarter combined with the revenue contribution from acquired businesses fully offset the decrease in landscape maintenance ancillary services revenues described above. Segment Adjusted EBITDA Margin increased 40 basis points, to 17.4%, in the three months ended September 30, 2020, from 17.0% in the 2019 period, due to the overhead cost reductions as well as an increase in contract revenue margins, partially offset by the decline in ancillary services revenue.

For the fiscal year ended September 30, 2020, revenue in the Maintenance Services Segment decreased 4.1% to $1,739.1 million. Revenues from snow removal services were $163.1 million, a decrease of $82.0 million over the 2019 period and revenues from landscape services were $1,576.0 million, an increase of $7.7 million over the 2019 period. The decrease in snow removal services was primarily attributable to a decreased frequency of snowfall events, the geographical distribution of the snowfall events which negatively impacted the Mid-Atlantic, Northeast, and Midwest regions, the lower volume of snowfall per event and the lower relative snowfall in the fiscal year ended September 30, 2020 (for our current branch structure, snowfall for the fiscal years ended September 30, 2020 and 2019 was 61.6% and 86.3%, respectively, of the historical 10-year average for that twelve-month period). The increase in landscape services revenues was driven by a $101.9 million revenue contribution from acquired businesses, partially offset by a decrease of $94.2 million, the majority of which was due to a reduction in demand for ancillary services as a result of the COVID-19 pandemic.

Adjusted EBITDA for the Maintenance Services Segment for the fiscal year ended September 30, 2020 decreased 11.3% to $250.1 million. Segment Adjusted EBITDA Margin decreased 120 basis points to 14.4% versus 15.6% in the prior year. The decreases in Segment Adjusted EBITDA and Segment Adjusted EBITDA Margin were due to the decrease in net service revenues described above.

Development Services - Operating Highlights


Three Months Ended
September 30,


Fiscal Year Ended
September 30,

($ in millions)


2020


2019


Change


2020


2019


Change

Revenue


$

165.1


$

170.7


(3.3%)


$

610.6


$

595.4


2.6%

Adjusted EBITDA


$

26.3


$

26.7


(1.5%)


$

80.2


$

81.7


(1.8%)

Adjusted EBITDA Margin


15.9

%


15.7

%


20 bps


13.1

%


13.7

%


(60) bps

Capital Expenditures


$

(0.2

)


$

0.7


(128.6%)


$

9.4


$

10.6


(11.3%)

For the fourth quarter of fiscal 2020, revenue in the Development Services Segment decreased 3.3% to $165.1 million, principally driven by project and construction delays related to the COVID-19 pandemic.

Adjusted EBITDA for the Development Services Segment decreased slightly to $26.3 million in the quarter compared to $26.7 million in the prior year period. Segment Adjusted EBITDA Margin increased 20 basis points, to 15.9%, in the three months ended September 30, 2020, from 15.7% in the 2019 period, partially offsetting the decline in net service revenues described above.

For the fiscal year ended September 30, 2020, revenue in the Development Services Segment increased 2.6% to $610.6 million. The increase in Development Services revenues was driven by higher first half project volumes and a stronger first half project completion percentage compared to the prior year.

Adjusted EBITDA for the Development Services Segment decreased 1.8% to $80.2 million during the fiscal year ended September 30, 2020. Segment Adjusted EBITDA Margin decreased 60 basis points, to 13.1%, in the fiscal year ended September 30, 2020, from 13.7% in the 2019 period. The decreases in Segment Adjusted EBITDA and Segment Adjusted EBITDA Margin were due principally to the completion of certain large projects in the prior year and construction delays as a result of the COVID-19 pandemic, partially offset by the increase in net service revenues described above.

Total BrightView Cash Flow Metrics


Fiscal Year Ended
S eptember 30,

($ in millions)


2020


2019


Change

Cash Provided by Operating Activities


$

245.1


$

169.7


44.4%

Free Cash Flow


$

197.2


$

86.6


127.7%

Capital Expenditures


$

52.7


$

89.9


(41.4%)

Net cash provided by operating activities increased $75.4 million to $245.1 million for the fiscal year ended September 30, 2020, compared to $169.7 million for the prior year. This increase was primarily due to an increase in cash provided by improvements in net working capital, including accounts payable and other operating liabilities, unbilled and deferred revenue, and accounts receivable. The increase was partially offset by a decrease in cash provided by net income (loss).

Free Cash Flow for the fiscal year ended September 30, 2020 was $197.2 million, an increase of $110.6 million versus the prior year. The increase in Free Cash Flow was due to the increase in cash flows from operating activities of $75.4 million described above, as well as a decrease in capital expenditures of $37.2 million, partially offset by a decrease in proceeds from the sale of property and equipment of $2.0 million, each as described below.

For the fiscal year ended September 30, 2020, capital expenditures were $52.7 million, compared with $89.9 million in the prior year. The Company also generated proceeds from the sale of property and equipment of $4.8 million and $6.8 million in fiscal 2020 and 2019, respectively. Net of the proceeds from the sale of property and equipment in each year, net capital expenditures represented 2.0% and 3.5% of revenue in fiscal 2020 and 2019, respectively.

Total BrightView Balance Sheet Metrics

($ in millions)


September 30, 2020


September 30, 2019

Total Financial Debt1


$

1,172.3


$

1,170.2

Total Cash & Equivalents


$

157.1


$

39.1

Total Net Financial Debt2


$

1,015.2


$

1,131.1

Total Net Financial Debt to Adjusted EBITDA ratio3


3.7x


3.7x

1Total Financial Debt includes total long-term debt, net of original issue discount, and finance/capital lease obligations

2Total Net Financial Debt equals Total Financial Debt minus Total Cash & Equivalents

3Total Net Financial Debt to Adjusted EBITDA ratio equals Total Net Financial Debt divided by the trailing twelve month Adjusted EBITDA.

As of September 30, 2020, the Company’s Total Net Financial Debt was $1,015.2 million, a decrease of $115.9 million compared to $1,131.1 million as of September 30, 2019. The Company’s Total Net Financial Debt to Adjusted EBITDA ratio was 3.7x as of September 30, 2020 and September 30, 2019.

Recent Developments

Acquisition of Commercial Landscaping Company – All Commercial Landscaping Services (ACLS)

In September 2020, BrightView acquired ACLS, a full-service landscaping company specializing in landscape maintenance, irrigation, enhancement, arbor care and water management. Their clients include commercial, municipal, multi-family and retail organizations throughout the greater Fresno market.

Disposal of BrightView Tree Company, and Acquisition of Commercial Landscaping Company – Commercial Tree Care, Inc. (CTC)

In September 2020, BrightView sold its tree nursery business, BrightView Tree Company, and in October 2020, BrightView acquired CTC, a full-service tree care company based in San Jose, Calif. Founded in 1992, CTC is a full-service tree care provider specializing in pruning, tree removal, stump grinding, cabling, bracing, fertility treatment, pest and disease control, install and transplant, forestry fire fighting and timber harvesting. CTC also consults for development, appraisal, maintenance plans and overall site evaluation. The combination of these two transactions support BrightView’s overall strategic growth plan to redeploy assets from the Development segment to the Maintenance segment, as CTC will be accounted for in the Maintenance segment and BrightView Tree Company was accounted for in the Development segment.

Acquisition of Commercial Landscaping Company – Water, Land, Environment (WLE), LLC

In October 2020, BrightView acquired WLE, a commercial landscape maintenance and development company headquartered in Austin, Texas. Founded in 2003, WLE (Water | Land | Environment) is a full-service commercial landscape management company, whose 250-member team serves HOA, developer, commercial, and municipal clients across three markets in Central Texas.

COVID-19 Update

  • Throughout the entire country, landscape maintenance is recognized as an essential service.
  • All branches are operational with no limitations on scope of services.
  • Executed downturn playbook and are continuing to exercise prudence, limiting discretionary spending, managing capital expenditures and working capital, and enhancing liquidity.
  • Prioritizing additional actions to protect revenue and margins, and preserve cash in the event of a continued and prolonged resurgence.
  • Specific Health and Safety actions include:
    • Proactively communicating critical information from CDC to employees.
    • Implemented branch based social distancing and hygiene and sanitization procedures.
    • Continuing to prohibit non-essential travel and mandated work from home policies as applicable.
    • Adhering to state and local mandates and guidelines.
    • Tracking current and potential exposures, imposing quarantine measures, and assigning case workers.
    • Implemented protocols requiring face coverings.

Conference Call Information

A conference call to discuss the fourth quarter and full-year fiscal 2020 financial results is scheduled for November 18, 2020, at 10 a.m. EST. The U.S. toll free dial-in for the conference call is (877) 273-7124 and the international dial-in is (647) 689-5396. The conference passcode is 8092614. A live audio webcast of the conference call will be available on the Company’s investor website, where presentation materials will be posted prior to the call.

A replay of the call will be available from 1 p.m. EST on November 18, 2020 to 11:59 p.m. EST on November 25, 2020. To access the recording, dial (800) 585-8367 or (416) 621-4642 (Conference ID 8092614).

Blue Bell - Corporate

BrightView Reports Third Quarter Fiscal 2020 Results

BrightView Reports Third Quarter Fiscal 2020 Results

BrightView Holdings, Inc. (NYSE: BV) (the “Company” or “BrightView”), the leading commercial landscaping services company in the United States, today reported unaudited results for the third quarter ended June 30, 2020.

This press release features multimedia. View the full release here: https://www.businesswire.com/news/home/20200805005317/en/

(Graphic: Business Wire)

(Graphic: Business Wire)

“Our quarterly results highlight the resiliency of our contract-based business and reflect the positive underlying trends of our strong-on-strong acquisition strategy, cash generation and liquidity, and our on-going focus on working capital and reducing capital expenditures,” said Andrew Masterman, BrightView President and Chief Executive Officer. “Our services and results of operations continue to benefit from a designation as an essential service. Our team has done an incredible job responding to the COVID-19 crisis by prioritizing health and safety and by delivering solid results in a challenging operating environment.”

“Despite ancillary softness and project delays, COVID-19 impacts to date have been modest due to our resilient contract revenue base and our earnings have benefited from cost management actions. Cash generation remains exceptional, margins strong, our capex requirements are modest, and we expect our M&A pipeline to continue to be a reliable and sustainable source of revenue growth,” Masterman said.” “We expect COVID-19 impacts will be felt over the next few quarters as conditions remain fluid. That said, we believe we are in a strong position to generate near-term solid EBITDA results, continued strong cash generation and stable top line performance.”

Third Quarter Fiscal 2020 Highlights

  • Net cash provided by operating activities of $76.2 million, an increase of 71.2% compared to $44.5 million in the prior year.
  • Free Cash Flow of $66.5 million, an increase of 385.4% compared to prior year of $13.7 million.
  • Total revenue of $608.1 million; a 7.5% decrease compared to prior year of $657.2 million.
  • Maintenance revenue of $460.0 million; a 6.5% decrease compared to prior year of $492.1 million;
    • Land revenue of $454.9 million; 6.5% decrease compared to prior year of $486.4 million.
  • Development revenue of $149.1 million, a 10.3% decrease compared to prior year of $166.3 million.
  • Net Loss of $2.4 million, or $(0.02) per share, and a net loss margin of 0.4%, compared to Net Income of $31.7 million, or $0.31 per share, and a net income margin of 4.8%, in the prior year.
  • Adjusted EBITDA of $91.0 million and Adjusted EBITDA margin of 15.0%, compared to Adjusted EBITDA of $101.9 million and Adjusted EBITDA margin of 15.5% in the prior year.

Nine Months Fiscal 2020 Highlights

  • Net cash provided by operating activities of $161.9 million, an increase of 48.3% compared to $109.2 million in the prior year.
  • Free Cash Flow of $119.8 million, an increase of 208.8% compared to prior year of $38.8 million.
  • Total Revenues for the nine months were $1,737.9 million, a 2.4% decrease compared to $1,779.9 million in the prior year.
  • Maintenance revenue of $1,295.1 million; a 4.6% decrease compared to prior year of $1,358.0 million;
    • Land revenue of $1,132.0 million; 1.7% growth compared to prior year of $1,112.6 million;
    • Snow revenue of $163.1 million; a 33.5% decrease compared to prior year of $245.4 million.
  • Development revenue of $445.5 million, a 4.9% increase compared to prior year of $424.7 million.
  • Net Loss of $35.5 million, or $(0.34) per share, and a net loss margin of 2.0%, compared to Net Income of $19.3 million, or $0.19 per share, and a net income margin of 1.1%, in the prior year.

Adjusted EBITDA, Adjusted EBITDA Margin, Adjusted Net Income, Free Cash Flow and Adjusted Earnings per Share are non-GAAP measures. Refer to the “Non-GAAP Financial Measures” and “Reconciliation of GAAP to Non-GAAP Financial Measures” sections for more information.

Adjusted EBITDA of $181.6 million and Adjusted EBITDA margin of 10.4%, compared to Adjusted EBITDA of $213.1 million and Adjusted EBITDA margin of 12.0% in the prior year, with the negative variance largely driven by the decremental margins due to the lower snow revenue. “During the quarter we generated $66.5 million in Free Cash Flow, which further helped to benefit our strong liquidity” said John Feenan, BrightView Executive Vice President and Chief Financial Officer. “We continue to maintain a disciplined financial policy while remaining intensely focused on accretive transactions and paying down debt. The fundamentals of our business and our industry remain strong and our cash generation, combined with modest capital needs, will continue to drive stockholder value.”

Fiscal 2020 Results – Total BrightView

Total BrightView - Operating Highlights


Three Months Ended
June 30,


Nine Months Ended
June 30,

($ in millions, except per share figures)


2020


2019


Change


2020


2019


Change

Revenue


$

608.1


$

657.2


(7.5%)


$

1,737.9


$

1,779.9


(2.4%)

Net (Loss) Income


$

(2.4

)


$

31.7


(107.6%)


$

(35.5

)


$

19.3


(283.9%)

Net (Loss) Income Margin


(0.4

%)


4.8

%


(520) bps


(2.0

%)


1.1

%


(310) bps

Adjusted EBITDA


$

91.0


$

101.9


(10.7%)


$

181.6


$

213.1


(14.8%)

Adjusted EBITDA Margin


15.0

%


15.5

%


(50) bps


10.4

%


12.0

%


(160) bps

Adjusted Net Income


$

44.0


$

47.0


(6.4%)


$

56.5


$

73.1


(22.7%)

(Loss) Earnings per Share, GAAP


$

(0.02

)


$

0.31


106.5%


$

(0.34

)


$

0.19


278.9%

Earnings per Share, Adjusted


$

0.42


$

0.46


(8.7%)


$

0.55


$

0.71


(22.5%)

Weighted average number of common shares outstanding


103.8


102.8


1.0%


103.6


102.7


0.9%

For the third quarter of fiscal 2020, total revenue decreased 7.5% to $608.1 million due to decreases in both the Maintenance Services Segment and Development Services Segment revenues. Net Loss was $2.4 million compared to Net Income of $31.7 million in the 2019 period, attributable to lower Income from operations, principally driven by an increase in non-recurring expenses and a decline in gross profit due to lower ancillary revenue, partially offset by an increase in Other income, a decrease in Interest expense and an increase in the Income tax benefit. Total Adjusted EBITDA decreased 10.7% due to a decrease in both Maintenance Services Segment Adjusted EBITDA and Development Services Segment Adjusted EBITDA, as discussed further below. The decrease in Adjusted EBITDA was partially offset by a decrease in corporate expenses of $2.1 million.

For the nine months ended June 30, 2020, total revenue decreased 2.4% to $1,737.9 million due to a decrease in Maintenance Services Segment revenues driven by meaningfully lower snowfall as compared to historical averages, partially offset by an increase in Development Services Segment revenues. Total Adjusted EBITDA was $181.6 million, down 14.8% versus the prior year, due to a decrease in Maintenance Services Segment Adjusted EBITDA driven by the decremental margins as a result of the lower snow revenue and a decrease in Development Services Segment Adjusted EBITDA, as discussed further below. The decrease in Adjusted EBITDA was partially offset by a reduction in corporate expenses of $1.5 million.

Fiscal 2020 Results – Segments

Maintenance Services - Operating Highlights


Three Months Ended
June 30,


Nine Months Ended
June 30,

($ in millions)


2020


2019


Change


2020


2019


Change

Landscape Maintenance


$

454.9


$

486.4


(6.5%)


$

1,132.0


$

1,112.6


1.7%

Snow Removal


$

5.1


$

5.7


(10.5%)


$

163.1


$

245.4


(33.5%)

Total Revenue


$

460.0


$

492.1


(6.5%)


$

1,295.1


$

1,358.0


(4.6%)

Adjusted EBITDA


$

84.0


$

91.1


(7.8%)


$

172.9


$

204.8


(15.6%)

Adjusted EBITDA Margin


18.3

%


18.5

%


(20) bps


13.4

%


15.1

%


(170) bps

Capital Expenditures


$

8.0


$

24.4


(67.2%)


$

34.0


$

54.4


(37.5%)

For the third quarter of fiscal 2020, revenue in the Maintenance Services Segment decreased 6.5% to $460.0 million. Revenues from landscape maintenance services were $454.9 million, a decrease of $31.5 million over the 2019 period, driven by a $60.1 million decrease principally due to a reduction in demand for ancillary services as a result of the COVID-19 pandemic, partially offset by a $28.6 million revenue contribution from acquired businesses.

Adjusted EBITDA for the Maintenance Services Segment in the quarter decreased 7.8% to $84.0 million, principally driven by the decrease in landscape maintenance ancillary services revenues described above. Segment Adjusted EBITDA Margin decreased 20 basis points versus the prior year, to 18.3%, in the three months ended June 30, 2020, from 18.5% in the 2019 period due to the decline in ancillary offset by overhead cost reductions.

For the nine months ended June 30, 2020, revenue in the Maintenance Services Segment decreased 4.6% to $1,295.1 million. Revenues from snow removal services were $163.1 million, a decrease of $82.3 million over the 2019 period and revenues from landscape services were $1,132.0 million, an increase of $19.4 million over the 2019 period. The decrease in snow removal services is primarily attributable to a decreased frequency of snowfall events, the geographical distribution of the snowfall events which negatively impacted the Mid-Atlantic, Northeast, and Midwest regions, the lower volume of snowfall per event and the lower relative snowfall in the nine months ended June 30, 2020 (for our current branch structure, snowfall for the nine months ended June 30, 2020 and 2019 was 61.1% and 86.3%, respectively, of the historical 10-year average for that nine-month period). The increase in landscape services revenues was driven by a $76.8 million revenue contribution from acquired businesses, partially offset by a decrease of $55.7 million principally due to a reduction in demand for ancillary services as a result of the COVID-19 pandemic.

Adjusted EBITDA for the Maintenance Services Segment for the nine months ended June 30, 2020 decreased 15.6% to $172.9 million, with the Adjusted EBITDA Margin decreasing 170 basis points versus the prior year. The decreases in Segment Adjusted EBITDA and Adjusted EBITDA Margin were due to the decrease in net service revenues described above.

Development Services - Operating Highlights


Three Months Ended
June 30,


Nine Months Ended
June 30,

($ in millions)


2020


2019


Change


2020


2019


Change

Revenue


$

149.1


$

166.3


(10.3%)


$

445.5


$

424.7


4.9%

Adjusted EBITDA


$

21.1


$

27.0


(21.9%)


$

53.9


$

55.0


(2.0%)

Adjusted EBITDA Margin


14.2

%


16.2

%


(200) bps


12.1

%


13.0

%


(90) bps

Capital Expenditures


$

1.6


$

3.2


(50.0%)


$

9.5


$

9.9


(4.0%)

For the third quarter fiscal 2020, revenue in the Development Services Segment decreased 10.3% to $149.1 million. The decrease in development services revenues was principally driven by project and construction delays related to shelter in place orders as a result of the COVID-19 pandemic.

Adjusted EBITDA for the Development Services Segment decreased 21.9% to $21.1 million in the quarter. Segment Adjusted EBITDA Margin decreased 200 basis points, to 14.2%, in the three months ended June 30, 2020, from 16.2% in the 2019 period. The decrease in Segment Adjusted EBITDA and Segment Adjusted EBITDA Margin was due principally to the completion of certain large projects in the prior year combined with the decrease in net service revenues described above.

For the nine months ended June 30, 2020, revenues for the Development Services Segment increased 4.9% to $445.5 million. The increase in development services revenues was driven by higher first half project volumes and a stronger first half project completion percentage compared to the prior year.

Adjusted EBITDA for the Development Services Segment decreased 2.0% to $53.9 million during the nine months ended June 30, 2020. Segment Adjusted EBITDA Margin decreased 90 basis points, to 12.1%, in the nine months ended June 30, 2020, from 13.0% in the 2019 period. The decrease in Segment Adjusted EBITDA and Segment Adjusted EBITDA Margin was due principally to the completion of certain large projects in the prior year, partially offset by the increase in net service revenues described above.

Total BrightView Cash Flow Metrics


Nine Months Ended
June 30,

($ in millions)


2020


2019


Change

Cash Provided by Operating Activities


$

161.9


$

109.2


48.3%

Free Cash Flow


$

119.8


$

38.8


208.8%

Capital Expenditures


$

45.9


$

77.2


(40.5%)

Net cash provided by operating activities for the nine months ended June 30, 2020 was $161.9 million, compared to $109.2 million for the prior year. This increase was primarily due to an increase in cash provided by improvements in net working capital, including accounts payable and other operating liabilities, unbilled and deferred revenue, and an increase in cash provided by accounts receivable, partially offset by a decrease in cash provided by net income and a decrease in cash provided by other operating assets.

Free Cash Flow for the nine months ended June 30, 2020 was $119.8 million, an increase of $81.0 million versus the prior year. The increase in Free Cash Flow was due to an increase in cash flows from operating activities of $52.7 million as well as a decrease in capital expenditures of $31.3 million, partially offset by a decrease in proceeds from the sale of property and equipment of $3.0 million.

For the nine months ended June 30, 2020, capital expenditures were $45.9 million, compared with $77.2 million in the prior year. The Company also generated proceeds from the sale of property and equipment of $3.8 million and $6.8 million in the nine months of fiscal 2020 and 2019, respectively. Net of the proceeds from the sale of property and equipment in the nine months, net capital expenditures represented 2.4% and 4.0% of revenue in the nine months of fiscal 2020 and 2019, respectively.

Total BrightView Balance Sheet Metrics

($ in millions)


June 30,
2020


September 30,
2019


June 30,
2019

Total Financial Debt1


$

1,201.5


$

1,170.2


$

1,181.5

Total Cash & Equivalents


$

89.9


$

39.1


$

10.9

Total Net Financial Debt2


$

1,111.6


$

1,131.1


$

1,170.6

Total Net Financial Debt to Adjusted EBITDA ratio3


4.1x


3.7x


3.9x

1Total Financial Debt includes total long-term debt, net of original issue discount, and finance/capital lease obligations
2Total Net Financial Debt equals Total Financial Debt minus Total Cash & Equivalents
3Total Net Financial Debt to Adjusted EBITDA ratio equals Total Net Financial Debt divided by the trailing twelve month Adjusted EBITDA.

As of June 30, 2020, the Company’s Total Net Financial Debt was $1,111.6 million, a decrease of $59.0 million compared to $1,170.6 million as of June 30, 2019. The Company’s Total Net Financial Debt to Adjusted EBITDA ratio was 4.1x as of June 30, 2020, compared with 3.9x as of June 30, 2019.

COVID-19 Update

  • Throughout the entire country, landscape maintenance is recognized as an essential service.
  • All branches operational with no limitations on scope of services.
  • Executing downturn playbook and implementing prudent actions to preserve cash.
  • Temporarily deferring discretionary merit increases and implemented a hiring freeze.
  • Continuing to limit discretionary spending and capital expenditures.
  • Specific Health and Safety actions include:
    • Proactively communicating critical information from CDC to employees.
    • Implemented branch based social distancing and hygiene and sanitization procedures.
    • Continuing to prohibit non-essential travel and mandated work from home policies as applicable.
    • Adhering to state and local mandates and guidelines.
    • Tracking current and potential exposures, imposing quarantine measures, and assigning case workers.
    • Implemented protocols requiring face coverings.

Conference Call Information

A conference call to discuss the third quarter fiscal 2020 financial results is scheduled for August 5, 2020, at 10 a.m. EDT. The conference call and webcast can be accessed by registering online here at which time registrants will receive dial-in details and a unique conference code for entry. The news release and a live webcast of the conference will also be accessible on the company's investor website.

A replay of the call will be available from 1 p.m. EDT on August 5, 2020 to 11:59 p.m. EDT on August 12, 2020. To access the recording, dial (800) 585-8367 or (416) 621-4642 (Conference ID 5266712).

Blue Bell - Corporate

BrightView Reports Second Quarter Fiscal 2020 Results

BrightView Reports Second Quarter Fiscal 2020 Results

BrightView Holdings, Inc. (NYSE:BV) (the “Company” or “BrightView”), the leading commercial landscaping services company in the United States, today reported unaudited results for the second quarter ended March 31, 2020.

This press release features multimedia. View the full release here: https://www.businesswire.com/news/home/20200507005220/en/

(Graphic: Business Wire)

(Graphic: Business Wire)

Second Quarter Fiscal 2020 Highlights

  • Maintenance revenue of $416.2 million; a 12.1% decline compared to prior year of $473.3 million;
    • Snow revenue of $102.5 million; a 46.5% decline compared to prior year of $191.5 million.
      • Decline driven by meaningfully lower snowfall as compared to historical averages.
    • Land revenue of $313.7 million; 11.3% growth compared to prior year of $281.8 million.
      • Maintenance land organic growth of 1.9%.
  • Development revenue of $143.6 million, a 15.8% increase compared to prior year of $124.0 million;
  • M&A strategy continues to be a reliable and sustainable source of revenue growth;
    • Acquired three commercial landscaping companies in critical and growing markets;
  • Net Loss of $20.5 million, or $(0.20) per share, and a net loss margin of 3.7%, compared to Net Loss of $3.6 million, or $(0.04) per share, and a net loss margin of 0.6%, in the prior year;
  • Adjusted EBITDA of $38.9 million and Adjusted EBITDA margin of 7.0%, compared to Adjusted EBITDA of $61.1 million and Adjusted EBITDA margin of 10.2% in the prior year, with the negative variance largely driven by the decremental margins due to the 46.5% lower snow revenue which would normally better leverage our fixed cost base during the snow season;
  • Cash flows from operating activities of $78.4 million, an increase of 34.5% compared to $58.3 million in the prior year;
  • Free Cash Flow of $59.4 million, an increase of 73.7% compared to prior year of $34.2 million.

Six Months Fiscal 2020 Highlights

  • Total Revenues for the six months were $1,129.8 million, a 0.6% increase compared to $1,122.7 million in the prior year;
  • Maintenance revenue of $835.1 million; a 3.5% decline compared to prior year of $865.8 million;
    • Snow revenue of $158.1 million; a 34.0% decline compared to prior year of $239.7 million.
      • Decline driven by meaningfully lower snowfall as compared to historical averages.
    • Land revenue of $677.0 million; 8.1% growth compared to prior year of $626.1 million.
      • Maintenance land organic growth of 0.7% excluding the impact in the first fiscal quarter from the wind down of our strategic managed exit initiative.
  • Development revenue of $296.4 million, a 14.7% increase compared to prior year of $258.4 million;
  • Net Loss of $33.1 million, or ($0.32) per share, and a net loss margin of 2.9%, compared to Net Loss of $12.4 million, or ($0.12) per share, and a net loss margin of 1.1%, in the prior year;
  • Adjusted EBITDA of $90.5 million and Adjusted EBITDA margin of 8.0%, compared to Adjusted EBITDA of $111.2 million and Adjusted EBITDA margin of 9.9% in the prior year, with the negative variance largely driven by the decremental margins due to the lower snow revenue;
  • Cash flows from operating activities of $85.7 million, an increase of 32.5% compared to $64.7 million in the prior year;
  • Free Cash Flow of $53.3 million, an increase of 112.4% compared to prior year of $25.1 million.

“We are very pleased with our Landscape maintenance organic revenue growth of 1.9% in the quarter, which was the strongest since our 2018 IPO. Free Cash Flow remains robust and our Development Segment delivered its third straight quarter of double-digit revenue growth,” said Andrew Masterman, BrightView President and Chief Executive Officer. “Historically low snowfall in many of our key regions had an adverse impact on both revenue and Adjusted EBITDA, but we are encouraged by the growth trend on snow contracts. Further, our acquisition strategy continued to be a reliable and sustainable source of revenue growth. As an essential service as defined by the Department of Homeland Security, all branches are operational at this time, with only isolated limitations as to the scope of services we can provide, specifically in the city of Boston, New York City and the San Francisco Bay Area. Keeping our employees, their families and our customers safe is our number one priority. BrightView is well positioned to overcome potential headwinds due to the COVID-19 outbreak and emerge from this crisis a stronger company.”

Fiscal 2020 Results – Total BrightView

Total BrightView - Operating Highlights


Three Months Ended
March 31,


Six Months Ended
March 31,

($ in millions, except per share figures)


2020


2019


Change


2020


2019


Change

Revenue


$

559.1


$

596.6


(6.3%)


$

1,129.8


$

1,122.7


0.6%

Net Loss


$

(20.5

)


$

(3.6

)


469.4%


$

(33.1

)


$

(12.4

)


166.9%

Net Loss Margin


(3.7

%)


(0.6

%)


516.7%


(2.9

%)


(1.1

%)


163.6%

Adjusted EBITDA


$

38.9


$

61.1


(36.3%)


$

90.5


$

111.2


(18.6%)

Adjusted EBITDA Margin


7.0

%


10.2

%


(320) bps


8.0

%


9.9

%


(190) bps

Adjusted Net Income


$

1.9


$

15.6


(87.8%)


$

12.5


$

26.0


(51.9%)

Earnings per Share, GAAP


$

(0.20

)


$

(0.04

)


(400.0%)


$

(0.32

)


$

(0.12

)


(166.7%)

Earnings per Share, Adjusted


$

0.02


$

0.15


(86.7%)


$

0.12


$

0.25


(52.0%)

Weighted average number of common shares outstanding


103.7


102.8


0.9%


103.5


102.6


0.9%

For the second quarter of fiscal 2020, total revenue decreased 6.3% to $559.1 million due to decreases in the Maintenance Services Segment driven by meaningfully lower snowfall as compared to historical averages, partially offset by increases in Development Services Segment revenues. Net Loss was $20.5 million compared to $3.6 million in the 2019 period, attributable to lower Income from operations and a decrease in Other income, partially offset by a decrease in Interest expense and an increase in the Income tax benefit. Total Adjusted EBITDA decreased 36.3% due to a decrease in Maintenance Services Segment Adjusted EBITDA driven by the decremental margins as a result of the lower snow revenue, partially offset by an increase in Development Services Segment Adjusted EBITDA, as discussed further below.

For the six months ended March 31, 2020, total revenue increased 0.6% to $1,129.8 million due to increases in Development Services Segment, partially offset by a decrease in Maintenance Services Segment revenues driven by meaningfully lower snowfall as compared to historical averages. Total Adjusted EBITDA was $90.5 million, down 18.6% versus the prior year, due to a decrease in Maintenance Services Segment Adjusted EBITDA driven by the decremental margins as a result of the lower snow revenue, partially offset by an increase in Development Services Segment Adjusted EBITDA, as discussed further below.

Fiscal 2020 Results – Segments

Maintenance Services - Operating Highlights


Three Months Ended
March 31,


Six Months Ended
March 31,

($ in millions)


2020


2019


Change


2020


2019


Change

Landscape Maintenance


$

313.7


$

281.8


11.3%


$

677.0


$

626.1


8.1%

Snow Removal


$

102.5


$

191.5


(46.5%)


$

158.1


$

239.7


(34.0%)

Total Revenue


$

416.2


$

473.3


(12.1%)


$

835.1


$

865.8


(3.5%)

Adjusted EBITDA


$

41.2


$

65.0


(36.6%)


$

88.9


$

113.7


(21.8%)

Adjusted EBITDA Margin


9.9

%


13.7

%


(380) bps


10.6

%


13.1

%


(250) bps

Capital Expenditures


$

14.3


$

18.9


(24.3%)


$

26.1


$

30.0


(13.0%)

For the second quarter fiscal 2020, revenue in the Maintenance Services Segment decreased 12.1% to $416.2 million. Revenues from snow removal services were $102.5 million, a decrease of $89.0 million over the 2019 period and revenue from landscape maintenance services were $313.7 million, an increase of $31.9 million over the 2019 period. The decrease in snow removal services was primarily attributable to a decreased frequency of snowfall events, the lower volume of snowfall per event and the lower relative snowfall in the three months ended March 31, 2020 as compared to the 2019 period (for our current branch structure, snowfall for the three months ended March 31, 2020 and 2019 was 43.3% and 86.2%, respectively, of the historical 10-year average for that three-month period). The increase in landscape maintenance services was driven by a $26.6 million revenue contribution from acquired businesses as well as $5.3 million or 1.9% growth in underlying commercial landscaping.

Adjusted EBITDA for the Maintenance Services Segment in the quarter decreased 36.6% to $41.2 million, with the Adjusted EBITDA Margin decreasing 380 basis points versus the prior year. The decrease in Adjusted EBITDA Margin was principally due to the decrease in snow removal revenues described above as well as an increase in selling, general, and administrative expenses to drive new business growth and increase customer retention.

For the six months ended March 31, 2020, revenue in the Maintenance Services Segment decreased 3.5% to $835.1 million. Revenues from snow removal services were $158.1 million, a decrease of $81.6 million over the 2019 period and revenues from landscape maintenance services were $677.0 million, an increase of $50.9 million over the 2019 period. The decrease in snow removal services is primarily attributable to a decreased frequency of snowfall events, the lower volume of snowfall per event and the lower relative snowfall in the six months ended March 31, 2020 (for our current branch structure, snowfall for the six months ended March 31, 2020 and 2019 was 57.9% and 85.6%, respectively, of the historical 10-year average for that six-month period). The increase in landscape services revenues was driven by a $48.2 million revenue contribution from acquired businesses as well as $4.4 million or 0.7% growth in underlying commercial landscaping excluding the impact in the first fiscal quarter from the wind down of our strategic managed exit initiative.

Adjusted EBITDA for the Maintenance Services Segment for the six months ended March 31, 2020 decreased 21.8% to $88.9 million, with the Adjusted EBITDA margin decreasing 250 basis points versus the prior year. The decrease in Segment Adjusted EBITDA was due to the decrease in snow removal revenues described above as well as an increase in selling, general, and administrative expenses to drive new business growth and increase customer retention.

Development Services - Operating Highlights


Three Months Ended
March 31,


Six Months Ended
March 31,

($ in millions)


2020


2019


Change


2020


2019


Change

Revenue


$

143.6


$

124.0


15.8%


$

296.4


$

258.4


14.7%

Adjusted EBITDA


$

13.7


$

11.0


24.5%


$

32.8


$

28.1


16.7%

Adjusted EBITDA Margin


9.5

%


8.9

%


60 bps


11.1

%


10.9

%


20 bps

Capital Expenditures


$

5.9


$

3.5


68.6%


$

7.9


$

6.7


17.9%

For the second quarter fiscal 2020, revenue in the Development Services Segment increased 15.8% to $143.6 million. The increase in Development Services revenues was driven by higher project volumes and an increase in the project completion percentage compared to the 2019 period.

Adjusted EBITDA for the Development Services Segment increased 24.5% to $13.7 million in the quarter. The increase in Segment Adjusted EBITDA was due to the increase in net service revenues described above combined with productivity improvements across the segment. Segment Adjusted EBITDA Margin increased 60 basis points, to 9.5%, in the three months ended March 31, 2020, from 8.9% in the 2019 period.

Revenues for the Development Services Segment increased 14.7% to $296.4 million for the six months ended March 31, 2020. The increase in Development Services revenues was driven by higher project volumes and an increase in the project completion percentage compared to the prior fiscal period.

Adjusted EBITDA for the Development Services Segment increased 16.7% to $32.8 million during the six months ended March 31, 2020. The increase in Segment Adjusted EBITDA was due to the increase in net service revenues described above as well as increased productivity across the segment. Segment Adjusted EBITDA Margin increased 20 basis points, to 11.1%, in the six months ended March 31, 2020, from 10.9% in the 2019 period.

Total BrightView Cash Flow Metrics


Six Months Ended
March 31,


($ in millions)


2020


2019


Change


Cash Provided by Operating Activities


$

85.7


$

64.7


32.5%


Free Cash Flow


$

53.3


$

25.1


112.4%


Capital Expenditures


$

35.1


$

42.6


(17.6%)


Net cash provided by operating activities for the six months ended March 31, 2020 was $85.7 million, compared to $64.7 million for the prior year. This increase was primarily due to an increase in cash provided by accounts receivable and an increase in cash provided by unbilled and deferred revenue offset by a decrease in cash provided by other operating assets and a decrease in cash provided by accounts payable and other operating liabilities.

Free Cash Flow for the six months ended March 31, 2020 was $53.3 million, an increase of $28.2 million versus the prior year. The increase in Free Cash Flow was principally due to the increase in cash flows from operating activities of $21.0 million described above, as well as a decrease in capital expenditures of $7.5 million as further described below.

For the six months ended March 31, 2020, capital expenditures were $35.1 million, compared with $42.6 million in the prior year. The Company also generated proceeds from the sale of property and equipment of $2.7 million and $3.0 million in the first half of fiscal 2020 and 2019, respectively. Net of the proceeds from the sale of property and equipment in the six months, net capital expenditures represented 3.3% and 4.1% of revenue in the first half of fiscal 2020 and 2019, respectively.

Total BrightView Balance Sheet Metrics

($ in millions)

March 31,
2020


March 31,
2019


September 30,
2019

Total Financial Debt1

$

1,254.4


$

1,185.3


$

1,170.2

Total Cash & Equivalents

$

88.0


$

11.2


$

39.1

Total Net Financial Debt2 to Adjusted EBITDA ratio

4.1x


4.0x


3.7x

1Total Financial Debt includes total long-term debt, net of original issue discount, and finance/capital lease obligations

2Total Net Financial Debt equals Total Financial Debt minus Total Cash & Equivalents

As of March 31, 2020, the Company’s Total Net Financial Debt was $1,166.4 million, a decrease of $7.7 million compared to $1,174.1 million as of March 31, 2019. The Company’s Total Net Financial Debt to Adjusted EBITDA ratio was 4.1x as of March 31, 2020, compared with 4.0x as of March 31, 2019.

Second Quarter Acquisitions

During the second quarter, BrightView acquired Signature Coast Holdings, LLC, Summit Landscape Group, LLC and 4 Seasons Landscape Group, LLC. These acquisitions are consistent with BrightView’s long-term M&A strategy and further strengthens its presence in critical and growing markets:

  • Signature Coast’s operations span nine strategic locations in both California (Concord, Davis, Marin, Napa, Rocklin, Sacramento and Santa Rosa) and Nevada (Carson City and Reno). Signature provides landscape maintenance, irrigation, enhancement, and arbor care.
  • Established in 2011, Summit serves the Charlotte, Charleston and Hilton Head markets in the Carolinas, as well as clients in Nashville, Tennessee. The Summit team offers a full suite of landscaping services including turf management, agronomics, tree and plant care, landscape design and installation, storm water control and inspection, and soil stabilization.
  • 4 Seasons provides services across the Atlanta metropolitan market in landscape maintenance, hardscapes, irrigation, enhancement, arbor care and other facility support services to the commercial, multi-family, hospitality, municipal and HOA market segments.

COVID-19 Update

  • Throughout virtually the entire country, landscape maintenance is recognized as an essential service as defined by the Department of Homeland Security.
  • All branches operational; isolated limitations on the scope of services we can provide.
  • Executing downturn playbook and implementing prudent actions to preserve cash.
  • Temporarily deferring discretionary merit increases for all employees and implemented a hiring freeze.
  • Limiting all discretionary spending and capital expenditures.
  • Specific Health and Safety actions include:
    • Proactively communicating critical information from CDC to all employees.
    • Implemented branch based social distancing and hygiene and sanitization procedures.
    • Continuing to prohibit non-essential travel and mandated work from home policies as applicable.
    • Adhering to all state and local mandates and guidelines.
    • Tracking potential cases and exposure, assigning case workers, and launched paid sick leave.

Conference Call Information

A conference call to discuss the second quarter fiscal 2020 financial results is scheduled for May 7, 2020, at 10 a.m. EDT. The dial-in for the conference call is (833) 968-2326 and the international dial-in is (778) 560-2844. The conference ID is 7999761. A live audio webcast of the conference call will be available on the Company’s investor website https://investor.brightview.com, where the presentation materials will be posted prior to the call.

A replay of the call will be available from 1 p.m. EDT on May 7, 2020 to 11:59 p.m. EDT on May 14, 2020. To access the recording, dial (800) 585-8367 or (416) 621-4642. The conference ID is 7999761.

Blue Bell - Corporate

A Message from BrightView: COVID-19

A Message from BrightView: COVID-19 Working to keep you and our employees safe

As the largest provider of commercial landscaping services in the United States, BrightView is monitoring the COVID-19 outbreak closely. During this difficult time, BrightView remains committed to the health and safety of not just our nearly 22,000 team members, but of our many valued customers and the hundreds of communities across America in which we operate. In response to these events, we have made significant changes to operations across all of our service lines, following and often exceeding the recommendations of public health authorities. We are committed to helping keep essential services open and best caring for our customers’ living assets.


We thank you for your interest in BrightView and ask that you please take care of yourselves and one another.


Your friends at BrightView Landscapes

BrightView Logo

BrightView Reports First Quarter Fiscal 2020 Results, Reaffirms Full Year Fiscal 2020 Guidance

BrightView Reports First Quarter Fiscal 2020 Results, Reaffirms Full Year Fiscal 2020 Guidance

BrightView Holdings, Inc. (NYSE: BV) (the “Company” or “BrightView”), the leading commercial landscaping services company in the United States, today reported unaudited results for the first quarter ended December 31, 2019.

This press release features multimedia. View the full release here: https://www.businesswire.com/news/home/20200206005104/en/

(Graphic: Business Wire)

(Graphic: Business Wire)

First Quarter Fiscal 2020 Highlights

  • Total Revenues for the quarter were $570.7 million, an 8.5% increase versus the prior year, with 6.7% higher Maintenance Services Segment revenues and 13.7% higher Development Services Segment revenues;
  • Net Loss of $12.6 million, or $(0.12) per share, and a net loss margin of 2.2%, compared to Net Loss of $8.8 million, or $(0.09) per share, and a net loss margin of 1.7%, in the prior year;
  • Adjusted EBITDA of $51.7 million and Adjusted EBITDA margin of 9.1%, compared to Adjusted EBITDA of $50.1 million and Adjusted EBITDA margin of 9.5% in the prior year;
  • Adjusted Net Income of $10.6 million, or $0.10 per share, compared to Adjusted Net Income of $10.4 million, or $0.10 per share, in the prior year.

“We are pleased with our start to fiscal 2020. We saw another quarter of solid revenue growth in both operating segments and overall Adjusted EBITDA growth for the Enterprise. Our net new sales, which will benefit the upcoming ‘green’ maintenance season, are the highest ever generated; our development project bookings are ahead of last year’s pace and our strong-on-strong acquisition strategy already has to date added four companies with enough expected revenue impact to reach our full year fiscal 2020 targets,” said Andrew Masterman, BrightView President and Chief Executive Officer. “We also continue to make our planned investments in people and technology to support our sales and account manager teams, enhancing our customer relationships and driving both revenue growth and cash generation, that will drive continued value creation for our stockholders.”

Adjusted EBITDA, Adjusted EBITDA Margin, Adjusted Net Income, Free Cash Flow and Adjusted Earnings per Share are non-GAAP measures. Refer to the “Non-GAAP Financial Measures” and “Reconciliation of GAAP to Non-GAAP Financial Measures” sections for more information.

Fiscal 2020 Results – Total BrightView

Total BrightView - Operating Highlights


Three Months Ended
December 31,

($ in millions, except per share figures)


2019


2018


Change

Revenue


$

570.7


$

526.0


8.5%

Net Loss


$

(12.6

)


$

(8.8

)


43.2%

Net Loss Margin


(2.2

%)


(1.7

%)


29.4%

Adjusted EBITDA


$

51.7


$

50.1


3.2%

Adjusted EBITDA Margin


9.1

%


9.5

%


-40 bps

Adjusted Net Income


$

10.6


$

10.4


1.9%

Earnings per Share, GAAP


$

(0.12

)


$

(0.09

)


(33.3%)

Earnings per Share, Adjusted


$

0.10


$

0.10


Weighted average number of common shares outstanding


103.3


102.5


0.8%

For the first quarter of fiscal 2020, total revenue increased 8.5% to $570.7 million due to increases in both Maintenance Services Segment and Development Services Segment revenues. Net Loss was $12.6 million compared to $8.8 million in the 2018 period, attributable to lower income from operations, partially offset by an increase in other income and an increase in the income tax benefit. Total Adjusted EBITDA increased 3.2% driven by an increase in Development Services Segment Adjusted EBITDA, coupled with lower corporate expenses, partially offset by a decrease in Maintenance Services Segment Adjusted EBITDA, as discussed further below.

Fiscal 2020 Results – Segments

Maintenance Services - Operating Highlights


Three Months Ended
December 31,

($ in millions)


2019


2018


Change

Landscape Maintenance


$

363.3


$

344.5


5.5%

Snow Removal


$

55.6


$

48.0


15.8%

Total Revenue


$

418.9


$

392.5


6.7%

Adjusted EBITDA


$

47.7


$

48.7


(2.1%)

Adjusted EBITDA Margin


11.4

%


12.4

%


-100 bps

Capital Expenditures


$

11.7


$

11.1


5.4%

For the first quarter fiscal 2020, revenue in the Maintenance Services Segment increased 6.7% to $418.9 million. Acquisitions added 5.9% and snow removal services added 1.5% but these increases were partially offset by a 0.7% negative revenue contribution from commercial landscaping which included lower revenue due to the wind down of Managed Exits and the timing of new contracts.

Adjusted EBITDA for the Maintenance Services Segment in the quarter decreased 2.1% to $47.7 million, with the Adjusted EBITDA Margin decreasing 100 basis points versus the prior year. The decrease in Adjusted EBITDA Margin was principally due to an increase in employee and technology related costs, primarily driven by the timing of expenses related to incentive compensation and the increased investment in our sales and operational leadership teams.

Development Services - Operating Highlights


Three Months Ended
December 31,

($ in millions)


2019


2018


Change

Revenue


$

152.8


$

134.4


13.7%

Adjusted EBITDA


$

19.1


$

17.0


12.4%

Adjusted EBITDA Margin


12.5

%


12.6

%


-10 bps

Capital Expenditures


$

2.0


$

3.2


(37.5%)

For the first quarter fiscal 2020, revenue in the Development Services Segment increased 13.7% to $152.8 million. Project revenue, derived from the segment’s revenue growth in key markets and strong project pipeline, drove the result.

Adjusted EBITDA for the Development Services Segment increased 12.4% to $19.1 million in the quarter, positively affected by the increase in net revenue described above. Segment Adjusted EBITDA margin was relatively flat compared with the prior year period.

Total BrightView Cash Flow Metrics


Three Months Ended
December 31,

($ in millions)


2019


2018


Change

Cash Provided by Operating Activities


$

7.3


$

6.4


14.1%

Free Cash Flow


$

(6.2

)


$

(9.1

)


31.9%

Capital Expenditures


$

14.5


$

17.3


(16.2%)

Net cash provided by operating activities for the quarter ended December 31, 2019 was $7.3 million, compared to $6.4 million for the prior year. This increase was primarily due to an increase in cash provided by unbilled and deferred revenue coupled with a decrease in cash used by accounts payable and other operating liabilities, mostly offset by a decrease in cash provided by accounts receivable and an increase in cash used by other operating assets.

Free Cash Flow for the quarter ended December 31, 2019 was $(6.2) million, an increase of $2.9 million versus the prior year. The increase in Free Cash Flow was driven principally by a decline in capital expenditures of $2.8 million.

For the quarter ended December 31, 2019, capital expenditures were $14.5 million, compared with $17.3 million in the prior year. The Company also generated proceeds from the sale of property and equipment of $1.0 million and $1.8 million in the first quarter of fiscal 2020 and 2019, respectively. Net of the proceeds from the sale of property and equipment in the quarter, net capital expenditures represented 2.4% and 2.9% of revenue in the first quarter fiscal 2020 and 2019, respectively.

Total BrightView Balance Sheet Metrics

($ in millions)


December 31,
2019


December 31,
2018


September 30,
2019

Total Financial Debt1


$

1,165.4


$

1,179.1


$

1,170.2

Total Cash & Equivalents


$

10.3


$

17.7


$

39.1

Total Net Financial Debt2 to Adjusted EBITDA ratio


3.8x


4.1x


3.7x

1Total Financial Debt includes total long-term debt, net of original issue discount, and capital lease obligations

2Total Net Financial Debt equals Total Financial Debt minus Total Cash & Equivalents

As of December 31, 2019, the Company’s Total Net Financial Debt was $1,155.1 million, a decrease of $6.3 million compared to $1,161.4 million as of December 31, 2018. The Company’s Total Net Financial Debt to Adjusted EBITDA ratio was 3.8x as of December 31, 2019, compared with 4.1x as of December 31, 2018.

Recent Developments

Acquisition of Signature Coast Holdings, LLC

In January, BrightView acquired Signature Coast Holdings, LLC. (“Signature Coast”) a commercial landscaping company headquartered in Napa, CA. Terms of the transaction were not disclosed.

Signature Coast’s operations span nine strategic locations in both California (Concord, Davis, Marin, Napa, Rocklin, Sacramento and Santa Rosa) and Nevada (Carson City and Reno). The Company provides landscape maintenance, irrigation, enhancement, installation, arbor care, pest control and snow removal services under its three major brands: Coast Landscape Management, Signature Landscapes and C&R Landscape. The Company’s 600 trained and qualified landscape professionals serve clients across the corporate, HOA, multi-family and municipal segments.

Acquisition of Summit Landscape Group, LLC

In January, BrightView acquired Summit Landscape Group, LLC (“Summit”), a commercial landscaping company headquartered in Rock Hill, SC. Terms of the transaction were not disclosed.

Established in 2011, Summit has built a strong reputation among its clients for providing each of them with a comprehensive landscape solution and delivering outstanding workmanship and service beyond expectations. By taking a proactive, practical and responsive approach to customer service, Summit has set itself apart in each of the markets it serves: Charlotte (NC), Charleston and Hilton Head (SC) and Nashville (TN). The team of approximately 180 trained and skilled landscape professionals holds certifications to offer a full suite of landscaping services including, turf management, agronomics, tree and plant care, landscape design and install, irrigation install and repair, outdoor living (hardscapes), landscape lighting, erosion control, storm water control and inspection, soil stabilization, grading and snow and ice removal.

Conference Call Information

A conference call to discuss the first quarter fiscal 2020 financial results is scheduled for February 6, 2020, at 10 a.m. EST. The U.S. toll free dial-in for the conference call is (877) 273-7124 and the international dial-in is (647) 689-5396. The conference passcode is 8507717. A live audio webcast of the conference call will be available on the Company’s investor website https://investor.brightview.com, where presentation materials will be posted prior to the call.

A telephone replay will be available shortly after the broadcast through February 13, 2020, by dialing (800) 585-8367 from the U.S., and entering conference passcode 8507717. A replay of the audio webcast also will be archived on the Company’s investor website.

Blue Bell - Corporate

Amanda Orders Promoted to Executive Vice President and Chief Human Resources Officer

Amanda Orders has been promoted to Executive Vice President and Chief Human Resources Officer Amanda Orders has been promoted to Executive Vice President and Chief Human Resources Officer

BrightView Holdings, Inc. (NYSE: BV), the leading commercial landscaping services company in the United States, today announced that Amanda Orders, Senior Vice President of Human Resources for the company’s

Amanda Orders will serve on the company’s Executive Leadership Team
Amanda Orders, Executive Vice President and Chief Human Resources Officer, will serve on the company’s Executive Leadership Team

Maintenance Services segment, has been promoted to Executive Vice President and Chief Human Resources Officer, effective today.

Orders will serve on the company’s Executive Leadership Team and report directly to President and Chief Executive Officer Andrew Masterman.

“Mandy is an exceptional human resources executive, leader, and tireless advocate for our nearly 21,500 team members across the nation,” Masterman said. “She has made significant contributions in every dimension of human resources for this company and will be a great addition to senior leadership.”

Orders will be responsible for the overarching BrightView People Strategy, which includes talent acquisition, compensation, benefits management, career development, performance management, succession planning, equity administration, retention, training, and leadership and organizational development across all BrightView service lines.

Orders started with the company in 2012 as Human Resources Vice President.  She was promoted to Senior Vice President of Human Resources for Maintenance Services in 2016. Orders was a key contributor to the Brickman/ValleyCrest merger that created BrightView in 2014, and has played a central role in GROW, an internal advocacy program for the women of BrightView.

Prior to joining BrightView, Orders held leadership positions in Human Resources at Alliance Data, a leading provider of co-branded affinity credit cards, and the ScottsMiracle-Gro Company, the world’s leading marketer of consumer lawn and garden products. 

Orders, a graduate of the Ohio State University’s Fisher College of Business, will work out of the company’s headquarters campus in Blue Bell, Pa.

Blue Bell - Corporate
Subscribe to In the Press